Debugging PHPUnit Tests in NetBeans with XDebug
- PHP, Tips and Tricks, Tools
- May 13, 2011
Every now and then you run into this weird situation in your code, where something that was supposed to zig is now zagging and it makes no sense whatsoever. For me this ends up happening in my unit tests since i’m not running everything in the browser everytime and since my tests usually run more scenarios then a regular browser run, that’s where the weird stuff happens.
So your obvious way out is to add a few var_dumps into the code and try to understand what is happening, if you are doing that: STOP!
Drop that mouse and step away from your keyboard, you should be debugging not adding code to the mix. So debugging in a browser is a piece of cake in most IDEs like NetBeans and Zend Studio and so forth, but debugging your tests that are running on the command line take a few more cards up your sleeve. So this is how i configured my NetBeans IDE and my PHPUnit tests to communicate and let me debug what happens inside that crazy world.
Configure your NetBeans Debugging configuration
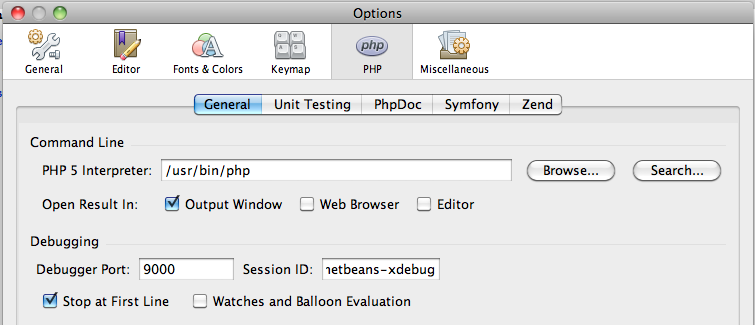
This is very straight forward, go to Preferences > PHP and set the debug settings, namely the port and a session id. For example: port 9000 and Session ID netbeans-xdebug.
Tell Xdebug what you want it to do
This is done by adding a few settings in you php.ini or if you use additional ini files, I recommend you create a xdebug.ini. You need to configure a few things here, we want xdebug to have remote debugging always enabled and we want to configure the port and ide keys we used in netbeans as well as configuring the output to be “dbgp”. This is how it will look in you ini:
xdebug.idekey=netbeans-xdebug xdebug.remote\_enable= On xdebug.remote\_handler=dbgp xdebug.remote\_mode=req xdebug.remote\_host=127.0.0.1 xdebug.remote\_port=9000
Make PHPUnit send stuff to NetBeans
So this is enough for you to do URL based debugging, but we want to debug our unit tests to pick up on those weird bugs with a easy to repeat script to lock down on it. For this to work you need to export a xdebug config variable in your local environment, so that XDebug kicks off the debugging based on this command line script. You will need to set XDEBUG_CONFIG to “idekey=netbeans-xdebug”, but setting it everytime is a nuisance, so my approach is to create a phpunit-debug file that can do this for me and allows me to kick off debugging by simply changing the executable. This is the content of this file:
export XDEBUG\_CONFIG="idekey=netbeans-xdebug"; phpunit $@
Make NetBeans start a debug session and not open a browser window
One last thing is needed for things to run smoothly. When you click on debug in Netbeans the usual process is for it to open up a browser window and debug from there, but we don’t want that, so we need to tell it to not open a browser. This is done by accessing File > Project Properties > Run Configuration and clicking on the “Advanced” button, here you can select “Do no open a browser” and you are set. 
Running Debugging
To start a debugging session you will need to follow these steps:
- Click on “Debug Project” button. Now Netbeans will start waiting for a connection.
- Go to command line and run phpunit-debug. Now debugging starts, if you selected “Stop on first line” phpunit file will be opened on your IDE, click play and you are off.
There you go. Now you are all set to debug your tests and understand better what is triggering that failure deep down inside your suite.


